Autophagy Watch
Features
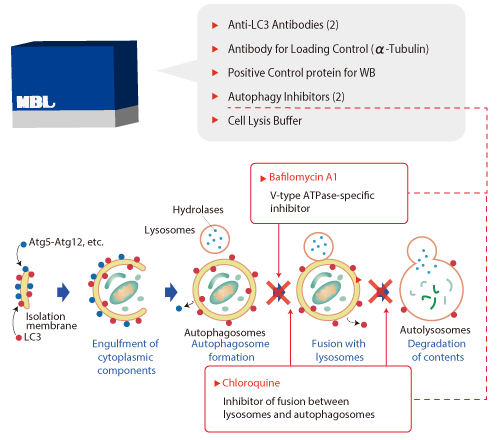
- Autophagy Watch contains a set of anti-LC3 antibodies and autophagy inhibitors. The Western blotting (WB)-based Autophagy Flux Assay can detect the induction of autophagy.
- The antibody for WB is conjugated to HRP, and does not require a secondary antibody. Advantages include a shorter assay time and the absence of nonspecific signal from the secondary antibody.
- The lysosomal inhibitors chloroquine and bafilomycin A1 are included as autophagy inhibitors. Simply dilute 1,000-fold with culture medium.
- An antibody for cell staining is also included in this kit. Autophagosomes in the cell can be visualized and monitored by staining with a fluorescence-labeled secondary antibody.
What Is the Autophagy Flux Assay?
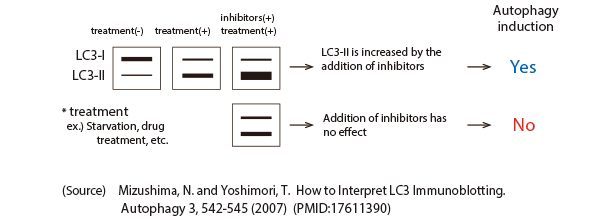
LC3-II is localized to the isolation membrane (phagophore) and the autophagosomal membrane.Induction of autophagy cannot be determined by simply detecting an increase in LC3-II band intensity on Western blotting.
The Autophagy Flux Assay compares samples treated with or without lysosomal inhibitors to allow assessment of the induction of autophagy.

Reference :Mizushima N, Yoshimori T. How to interpret LC3 immunoblotting. Autophagy. 3, 542-5 (2007) (PMID: 17611390)
Kit Components

| Product Name | Clone | Isotype | Size | Application | Reactivity |
|---|---|---|---|---|---|
| Anti-LC3 mAb-HRP-DirecT | 8E10 | Mo IgG2aκ | 100 µL | WB | Hu, Mo, Rat, Hm |
| Anti-LC3 mAb | 4E12 | Mo IgG1κ | 50 µL, 2mg/mL | WB(weak), IC, IP, FCM, Immuno-EM | Hu, Mo, Rat, Hm |
| Anti-α-Tubulin pAb-HRP-DirecT | Polyclonal | Rab IgG(aff.) | 100 µL | WB Positive Control | Hu, Mo, Rat, Hm,Chi |
| Positive control for anti-LC3 antibody | 100 µL (20 tests) | ||||
| Chloroquine solution (x1000) | 100 µL | ||||
| Bafilomycin A1 solution (x1000) | 100 µL | ||||
| Cell lysis buffer (x5) | 1 mL x2 |
Application WB: Western Blotting, IH: Immunohistochemistry, IC: Immunocytochemistry, IP: Immunoprecipitation, FCM: Flow Cytometry
Species Cross-Reactivity Hu: Human, Mo: Mouse, Rab: Rabbit, Hm: Hamster, Chi: Chicken
Detection of autophagy induction using Autophagy Watch : WB

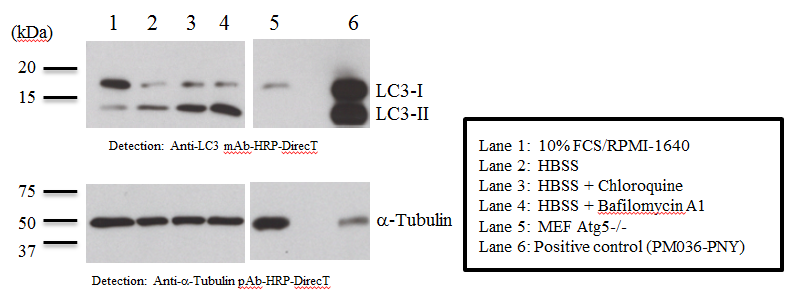
LC3-II is increased in cells under starvation conditions, compared with cells under control (nutrient) conditions (Lanes 1, 2). When starved cells were treated with the lysosomal inhibitor chloroquine or bafilomycin A1, LC3-II band intensity is further increased (Lanes 3, 4). This increase indicates an accumulation of autophagosomes caused by the inhibition of their degradation. Induction of autophagy in starved cells can be confirmed by comparing these results.
Detection of autophagy induction using Autophagy Watch : IC

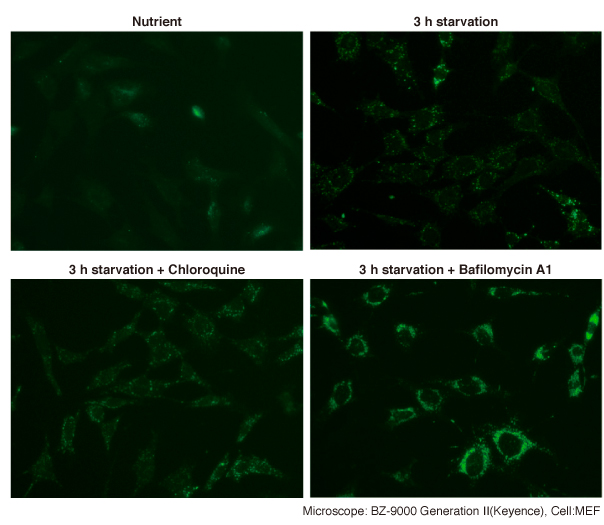
Autophagosomes can be seen as punctate staining inside the cells starved in HBSS (Hank's Balanced Salt Solution).
The addition of the inhibitors increases the number of autophagosomes.


